

Organizations rely on Business Central for operational and financial reporting, but many teams still export data to Excel when they need flexible analysis, custom layouts, or presentation‑ready visuals. Traditionally, this meant a significant amount of manual work: formatting, building pivot tables, adding calculated fields, and assembling dashboards.
What’s changed recently isn’t just one new feature, it’s the combination of Copilot capabilities across M365, and how they now naturally show up inside of Excel. When you put Excel Copilot, Agent Mode, and in‑place editing together, Excel stops being a passive spreadsheet tool and starts acting like an active reporting assistant.
The Power of Copilot in Excel
When people hear Copilot in Excel, they often think of formula help or quick explanations. That’s useful, but it’s not the full picture, especially for Business Central reporting. Inside Excel, Copilot now benefits from the broader Microsoft 365 Copilot ecosystem:
- Context Awareness: Copilot understands the structure of your workbook, existing sheets, tables and formulas, not just what is stuck inside a single cell.
- Natural Language Intent: You don’t need to be an Excel formula wizard, instead you can focus on describing outcomes.
Examples: “Build a clean invoice detail report”, or “Summarize revenue by month”. - Agentic execution: In Agent Mode, Copilot doesn’t just answer questions or suggest formulas, rather, it takes action across your sheets, writes and tests formulas, layouts and formatting.
Business Central provides a strong, structured foundation for exposing data to Excel. When that data is consistent and well-shaped, Copilot is at it’s best. In practice, Copilot in Excel acts as three roles at once: a report designer that understands accounting and operational data, an analyst that can build layouts and summarize on demand, and a refactoring assistant that can safely evolve your workbook as requirements change.
To leverage the power of your M365 Copilot license, make sure that you are saving your Excel file within OneDrive. This gives Copilot full workbook context and enables any agents available in your environment, directly inside Excel.
As a report matures, the biggest productivity gains come from Edit with Copilot. You can adjust formulas, standardize formatting, and reorganize layouts while reviewing proposed changes before applying them. Being able to evolve report layouts, without touching the underlying data model, is one of the most powerful aspects of Copilot-driven reporting.
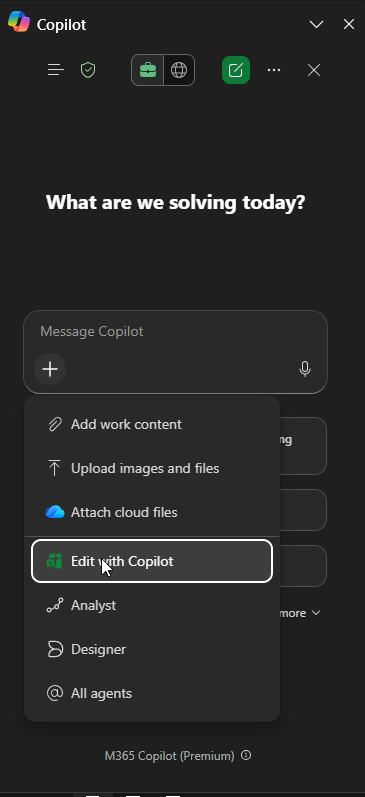
All of this works without APIs, AL development, or Excel expertise. You can make the shift when you are no longer telling Excel how to do each step, instead you are telling Copilot what the finished result should be. The journey to get the result is quite the adventure.
Prep your dataset
I I asked Copilot to help me come up with some Excel Report ideas that I believe would be helpful for businesses operating within Business Central. Not every report dataset has all of the fields that we need, so I started with a report extension for Report 1306 – Standard Sales Invoice. This report contains line-level detail for posted sales, making it an ideal starting point for reporting revenue analysis, margin calculations, customer and item performance, as well as trend reporting.
Additional columns I added to the dataset:
- Unit Cost
- Line Amount
Prompts to build out the report
Once we have our report dataset, we now need to create the actual report layout.
Let’s first focus on creating a clean, professional layout.
# Prompt: Create Invoice Detail Layout for BC Sales DataYou are working with exported data from Business Central **Report 1306 – Standard Sales Invoice**, extended to include `Unit Cost` and `Line Amount`. Create a clean, professional, analysis-ready worksheet based on this dataset.**IMPORTANT**: The new sheet must use **formulas that dynamically reference the source dataset**. Do NOT copy and paste static data values. The data should update automatically if the source dataset changes.1. Create a new sheet named **"Invoice Detail"**.2. On this sheet, create an Excel table that **uses formulas to pull data from the source dataset**: - **Use dynamic formulas** (e.g., FILTER function, structured table references, or dynamic array formulas) to reference the original dataset. - **Filter the data to include only rows where `Item No.` is not blank.** - Because this is a report dataset (used for totaling, showing captions, etc.), we only want detail lines that have actual items. - Use clear, readable header text based on the column names. - **Ensure the solution dynamically handles any dataset size** (from 1 row to 1,000+ rows) by using formulas that automatically expand/contract. - Format dates with MM/DD/YYYY format. 3. Apply professional formatting: - Bold headers. - Alternating row shading for the data region. - Freeze the top row. - Auto-size all columns to fit their content.4. At the top of the sheet (above the table), add a summary section that shows: - Total revenue (sum of **Line Amount**). - Total invoice count (count of distinct **Invoice No.** or equivalent). - Average line amount (average of **Line Amount**). - Format these summary values with appropriate currency/number formats.5. Do **not** add charts, pivot tables, or additional calculated columns on this sheet yet. - This sheet should serve as the primary, well-formatted data source for downstream analysis and dashboards.
I specifically want to call out how important it is to let the Agent know that we need this to be a dynamic sheet, as we want this data to be “recalculated” based on the data that is flowing into the Data sheet when we run the report.
IMPORTANT: The new sheet must use formulas that dynamically reference the source dataset. Do NOT copy and paste static data values. The data should update automatically if the source dataset changes.
Without this specification, your report would be stale and static, and not dynamically based on the Data sheet.
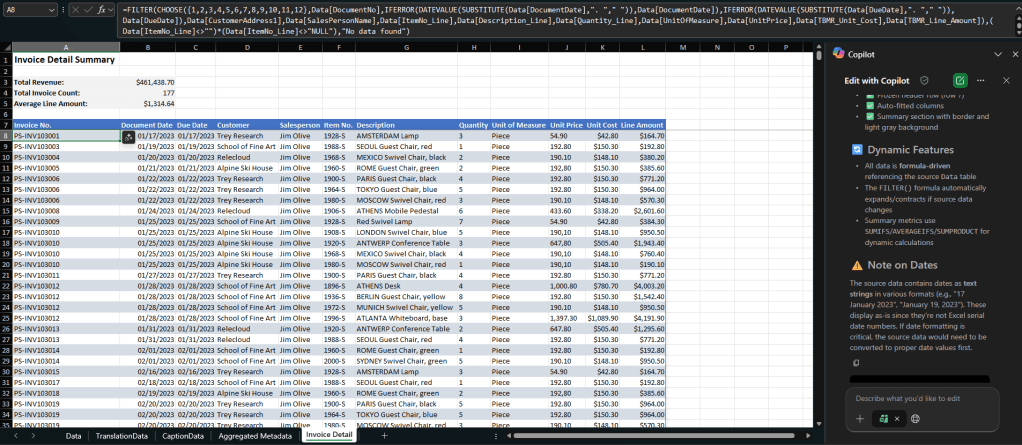
🪄 Copilot decided to include the following fields:
Invoice No. | Document Date | Due Date | Customer No. | Customer Name | Item No. | Description | Quantity | Unit of Measure | Unit Price | Unit Cost | Line Amount | Salesperson
🧙♂️ All of the values are leveraging Dynamic Filters (so the values will update when the Data sheet is updated). We also filtered the lines for Items.
Now let’s add some calculated columns.
Caveats when adding to an existing Excel Report Layout
Anytime you add calculations, explicitly tell Copilot to integrate them into the existing dynamic formula. Otherwise you can end up with disconnected logic.
Add two calculated columns:
1. Year - Month, grouping Posting Date into YYYY-MM format.
2. Margin %, calculated as
      (Line Amount - (Unit Cost * Quantity)) / Line Amount.
Format the margin column as a percentage with one decimal place.

**Please add this to the existing Dynamic Filter formula** and ensure consistent formatting.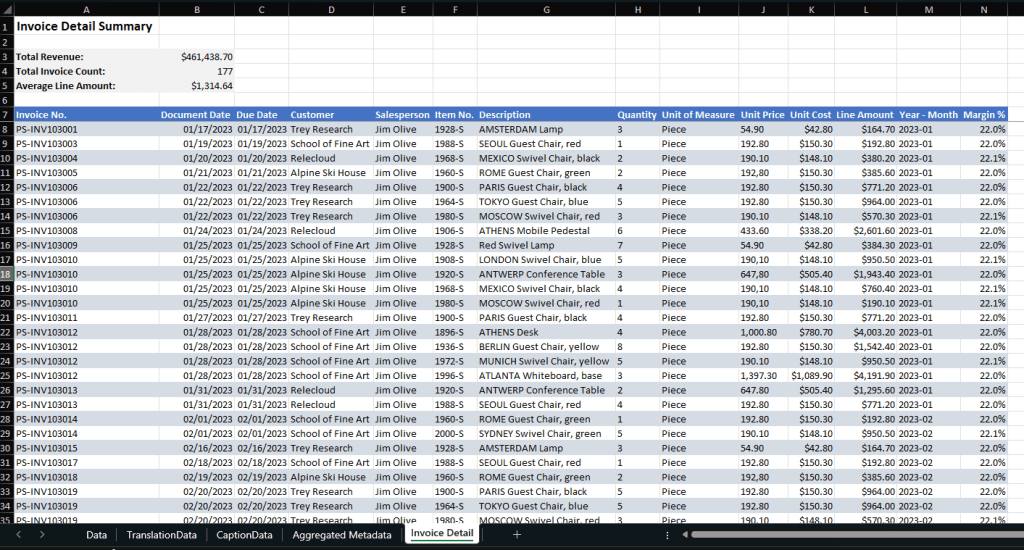
You can see that it added the Year – Month and Margin % to the end of the Dynamic content.
Surfacing Business Central filters
Finally, I was thinking it would be nice to see the filters that are being used to render the report. This is showing why the report looks the way it does. Here’s the prompt I started with.
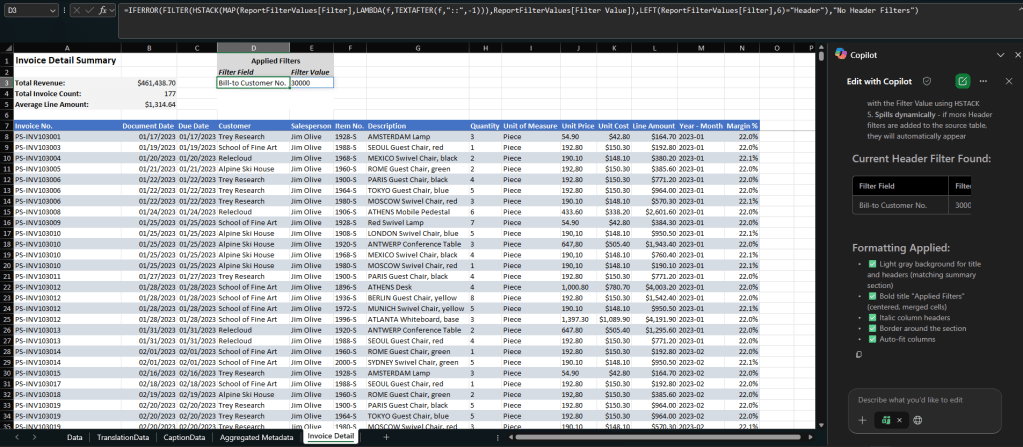
See on the Aggregated Metadata sheet in the ReportFilterValues table, If there are filters that start with Header, we want to display those on the Invoice Detail at the top.We ONLY want to include the name of the field-- example: Bill-to Customer No., or Posting Date, and then the value next to it.Please ensure this is dynamic (meaning it's a filter to these values)Add these "Applied Filters" to the right of the "Invoice Detail Summary"
We now have the dynamic filters displaying at the top of the Invoice Details.Now the report clearly communicates its filter context, which is a huge win for trust and usability.
KPI Summary
I then wanted to create dashboard. I started with the following prompt.
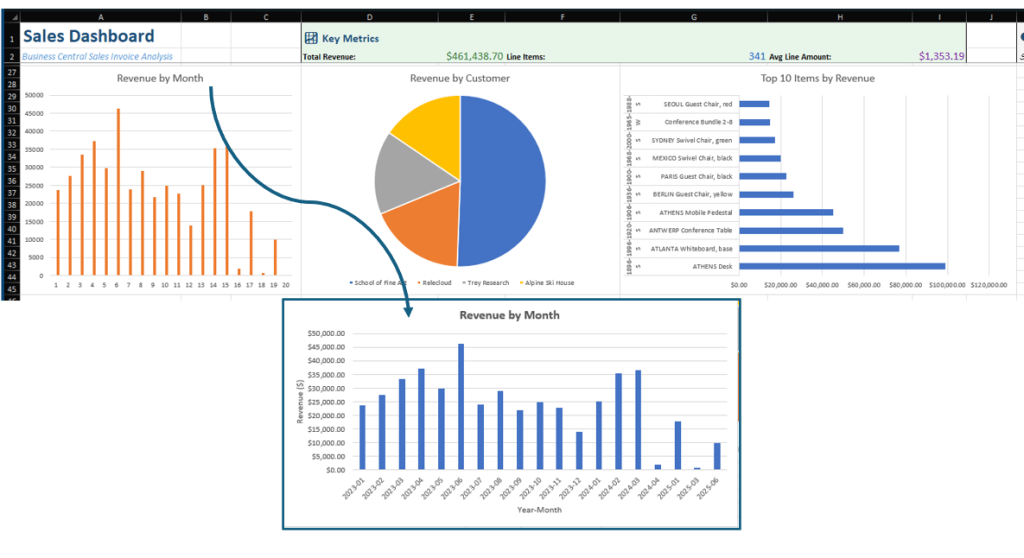
Create a new sheet with a dashboard summarizing revenue by month, top ten customers and top ten items. Add slicers for year, customer group and item category. Place all visuals in a new sheet called "Dashboard".
I was fairly impressed with the data visualizations that Copilot compiled. When I started doing a more in-depth review, I didn’t understand the Revenue by Month visualization, where it was essentially counting the months. I told Copilot I didn’t understand the visual, and it gave me a couple of different options to explore. Ultimately, I wanted it to show the Year – Month along the x-axis.
Editing and Refining with “Edit with Copilot”
Once your report exists, Edit with Copilot becomes the safest and fastest way to evolve it. This is where Copilot really shines compared to traditional trial‑and‑error Excel work. You can ask Copilot to change formulas without breaking dependencies. You can refactor layouts without manually touching every cell. You can standardize formatting across sheets consistently. Examples I use constantly:
- “Refactor this sheet to use consistent currency formatting.”
- “Rename columns to be more business‑friendly.”
- “Move this summary section to the top and tighten spacing.”
- “Fix any spill errors and ensure formulas expand safely.”
As we move from writing code (or in this case Excel Formulas) and dive more into prompt engineering, we still need to see the importance of having the human in the loop. We know what the expectations are, and are able to verify the work that the Agent is completing.
Final Thoughts
Excel’s Copilot experience, especially combined with Agent Mode and Edit with Copilot, fundamentally changes how Business Central users build reports. You start with intent, not mechanics. You iterate safely, AND you end up with dynamic, professional quality reporting that stays accessible to the business. As the agentic frontier evolves, Excel is no longer just a sheet full of formulas. Working with Excel is now a part of the reporting experience.
