

I had the honor of presenting at DynamicsCon Live in Scottsdale, Arizona about one of the newer features in Business Central. You can now create and run Excel Report Layouts from Business Central (without any apps or custom code!)
Excel is the most popular spreadsheet system. At one point in time we all probably listed “proficient in Excel” on our resumes. Now is the time to dust up on all the functions and advanced processing capabilities within Excel to slice and dice your data from BC.
Excel Report Layouts were introduced in Business Central version 2022 Wave 1 (BC20).
This blog post will cover the four easy steps of creating an Excel Report Layout for Microsoft Dynamics 365 Business Central.
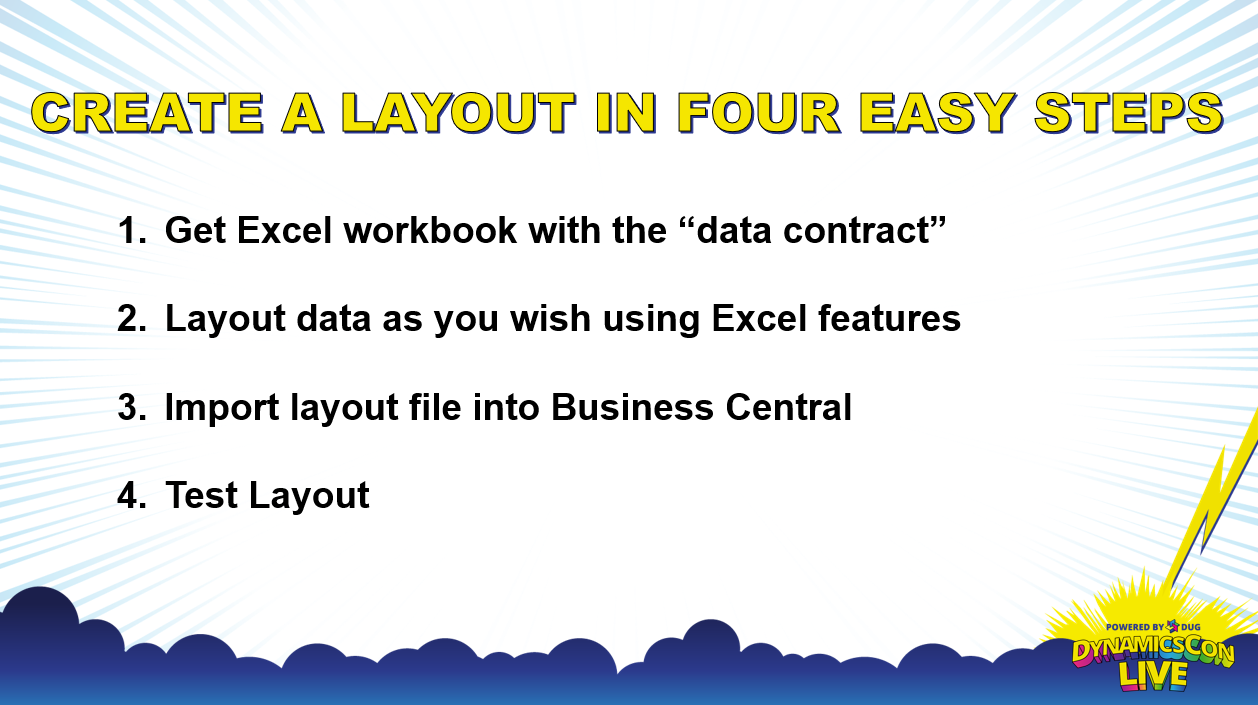
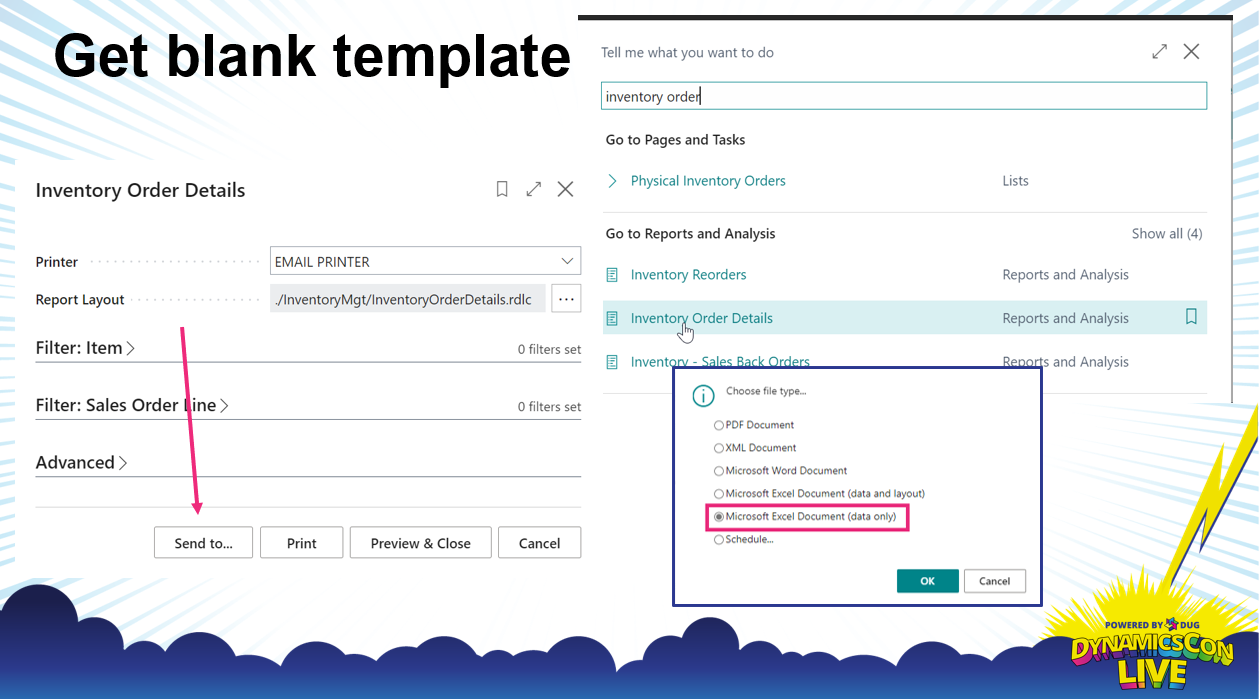
1. Get Excel Workbook with the “data contract”
Using any report from Business Central, you will run the report. Instead of Printing, you are going to click “Send to” and click “Microsoft Excel Document (data only)”. What this will do is send the data defined by the reports data structure to Excel, and download it to an Excel file with two tabs, “Data” and “Report Metadata”.
The data contract lives within the Data tab. Each time you “run” the report, the Data tab will be cleaned out and filled with new data. DO NOT CHANGE THE COLUMN HEADINGS as this is how Business Central knows where to put the data. Anything you build as part of your report layout should be in a new tab.
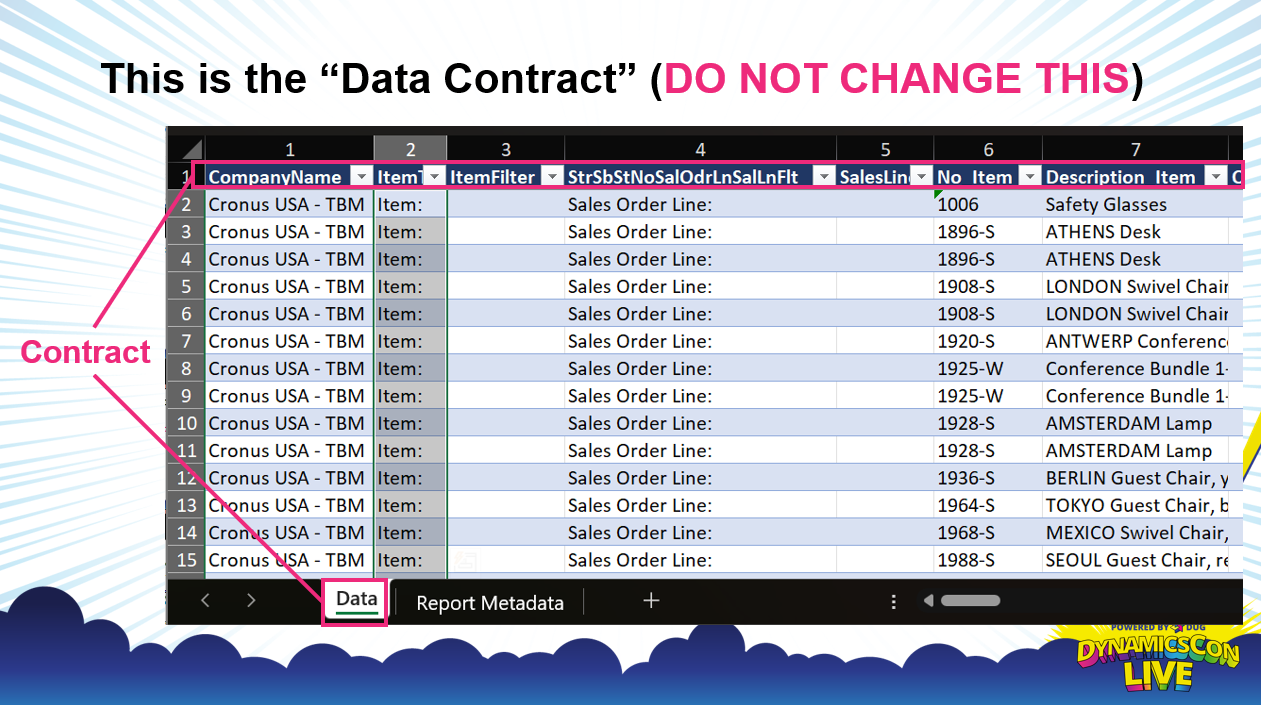
The Report Metadata tab will give you information about the backbone of the report. What version of BC was it created against, and what app holds the report object? What filters were applied in Business Central before the data was populated in Excel? All of these things are important to know in case you move the report to a new version of BC, or something breaks with an upgrade.
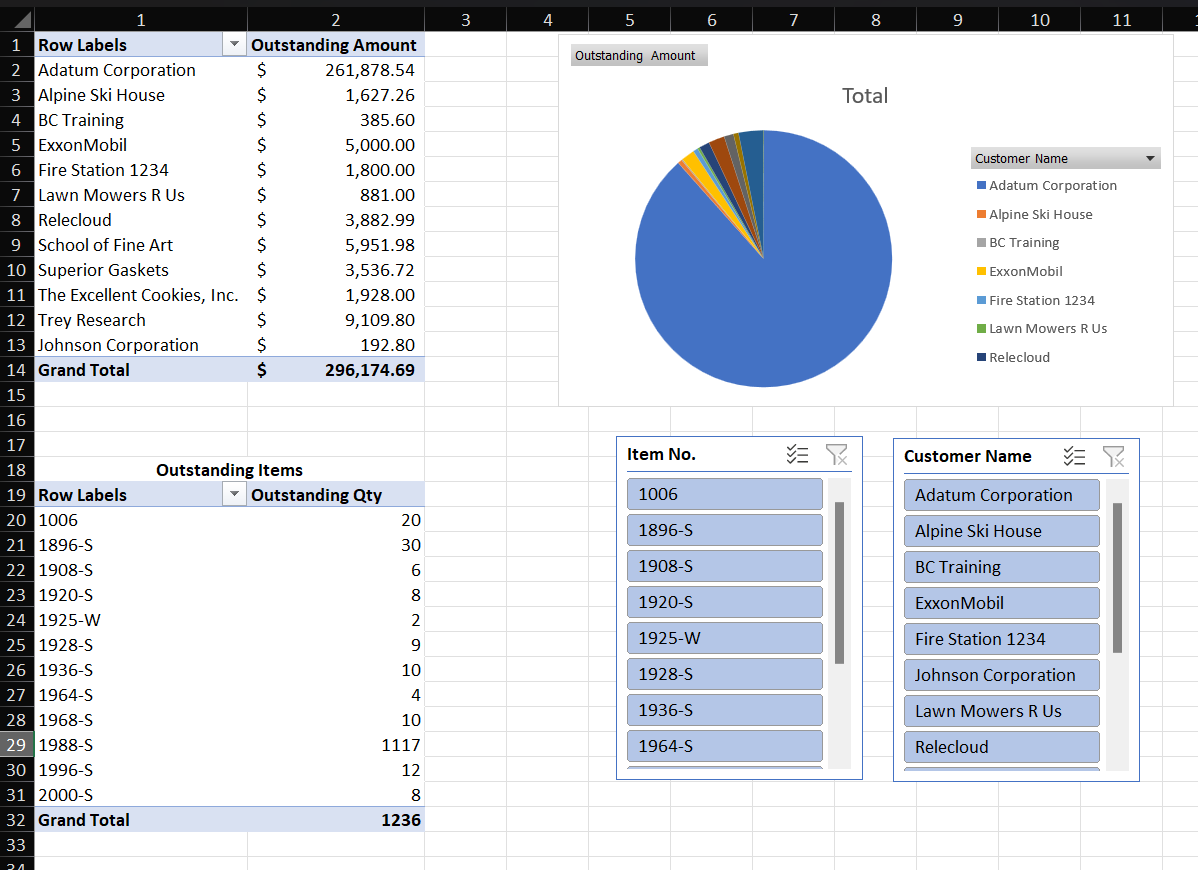
2. Layout data as you wish using Excel features
This is where you need to find your Excel gurus, and have them work their magic. In my presentation I utilized Pivot Tables and Pivot Charts to visualize data. We can now slice and dice data to drive business and financial decision making.
3. Import layout file into Business Central
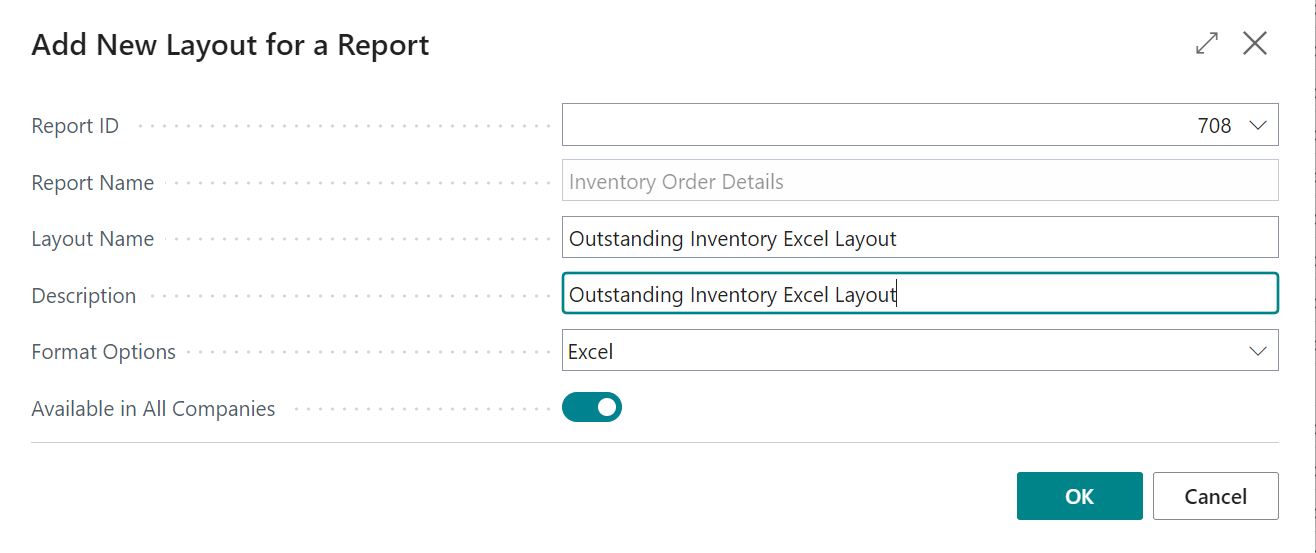
Now that you have built your Excel Report Layout, it’s time to import it into Business Central so it’s reusable. On Report Layouts, you will want to find the report you used for the data.

You will want to give it a name (probably include Excel Layout in the description), and make sure the Format option is set to Excel.
4. Test Layout
With your new Excel Report Layout selected, you can test it from the Report Layouts page by clicking Run Report in the menu. If needed, set filters, and click Download.
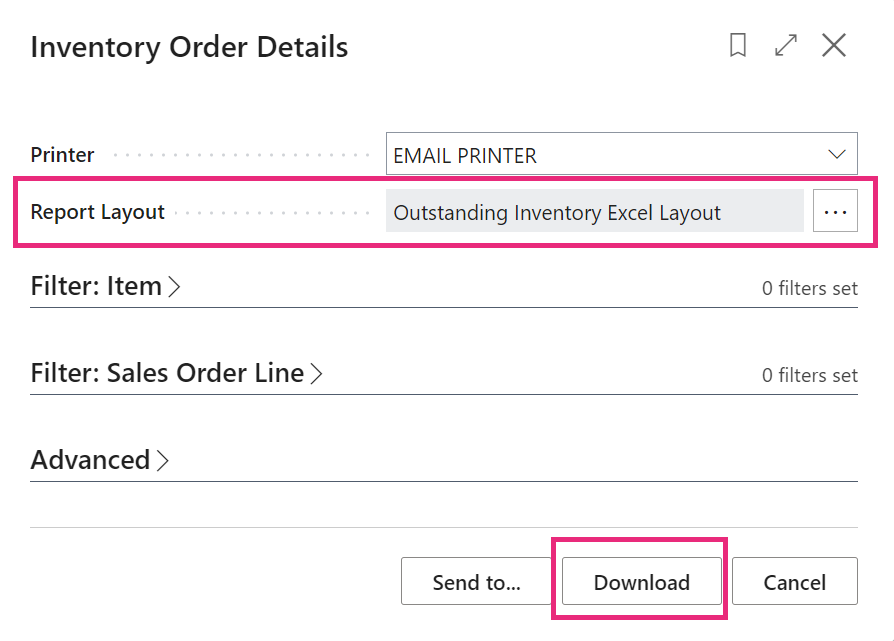
By default, this should download the Excel report to your local computer. If your organization has enabled the OneDrive Integration, the report will be downloaded to OneDrive/SharePoint, and should open in a new tab within your Internet Browser (just make sure your popups are disabled).
How it works on the BC Server
During the upload of your Excel Layout, all data is removed from the Data worksheet. When you run the report, the Data sheet is populated with new data. ForceFullCalculation and FullCalculationOnLoad are set to true in order to update all pivot table and graph references.
Excel Report Layouts are so easy to use, and are a must-learn for anyone using Microsoft Dynamics 365 Business Central. Please comment below if you found this helpful, or if you have any questions.

[…] tables, slicers, etc, you just have to Import the layout to Business Central. You can reference this blog post for more information on working with Excel Report […]
LikeLike