

Performance issues can be the bane of our existence, especially in the middle of a busy workweek. Not only do they slow users down, but they are frustrating to try and troubleshoot, and it’s oftentimes troublesome to schedule time *right now* when someone is experiencing issues. In this blog post we are going to add the Scheduled Performance Profiler as the new secret weapon in your troubleshooting toolbox, and dive into the insights available with the Performance Profiler.
Profiler Schedules
Administrators within Business Central can use the Profiler Schedules page to set schedules to record snapshots of business processes.

What makes this such a great tool
- You can schedule when you would like to record processes
- Maybe you don’t know when exactly a user is having issues. Does another process run that is affecting someone’s real-time work? Set a Profiler Schedule to try to catch those long-running processes.
- Perhaps it’s during another shift when an Admin isn’t readily available for troubleshooting.
- You will need to set a start date/time and end date/time for profiling a specific user.
💡To get the most accurate results (and limit the amount of data produced) you will want set a specific time period targeting when this user may be experiencing performance issues.
- Select the specific user you would like to profile
- You can specify the type of activity to be recorded. Your options include:
- Activity in the browser: This will track all of the activities performed by the user.
- Background tasks: Think scheduled jobs or background processing tasks initiated by AL code.
- Web Service Calls: Track those external interactions and see how they are impacting performance.
- Make sure you add a Description for what you are attempting to profile
- There is an Enabled toggle. Maybe you have collected the performance data, but you don’t want to continue monitoring until someone has been able to analyze the data collected. You could disable the profiler, and save the settings for later.
Advanced Schedule Settings
The default sampling is scheduled to take a snapshot of the AL code being executed every 100 milliseconds. You can adjust this time with the Sampling Frequency if you feel that some of the data is being “lost” when the method’s duration is shorter than your sampling frequency. Waldo’s blog post shared the following picture to illustrate how methods can be lost.
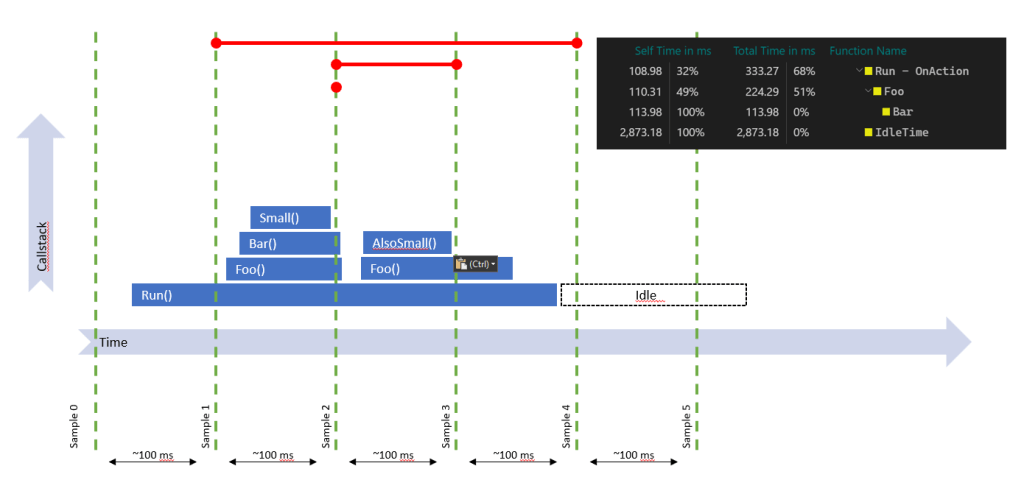
You can see where the procedure Small() and AlsoSmall() have a duration that falls within the Sampling Frequency, and do not actually show up in the Performance Profiler log. I would suggest adjusting this with caution, as the more data you are collecting, the more strain you are putting on the system. It’s like that quote from Spiderman, “with great power comes great responsibility”. Currently, we have the option to sample within increments of 50, 100 and 150 milliseconds.
The Activity Duration Threshold filters out short-lived activities so you can focus on significant performance issues. The default value is 500ms. You can adjust this as needed to hopefully weed out the activities that are not useful for analysis.

Finally, the Retention Policy specifies how long the profiling data should be retained. This defaults to 1 Week, so make sure someone is logging in and reviewing the data before it is deleted. (You also don’t want to have someone change this, and consume a lot of space with all of this profiling data).
Additional Notes
- Only one performance profile session can be scheduled for a given activity type for a given user for a specific time period.
- You cannot debug a session that has an active Profiler Schedule running. You can see the Active Schedule ID on the Profiler Schedules page
The image below is of the Profiler Schedules. You can see there are two enabled schedules. At the top of the page you can see the Active Schedule ID

Performance Profiler Details
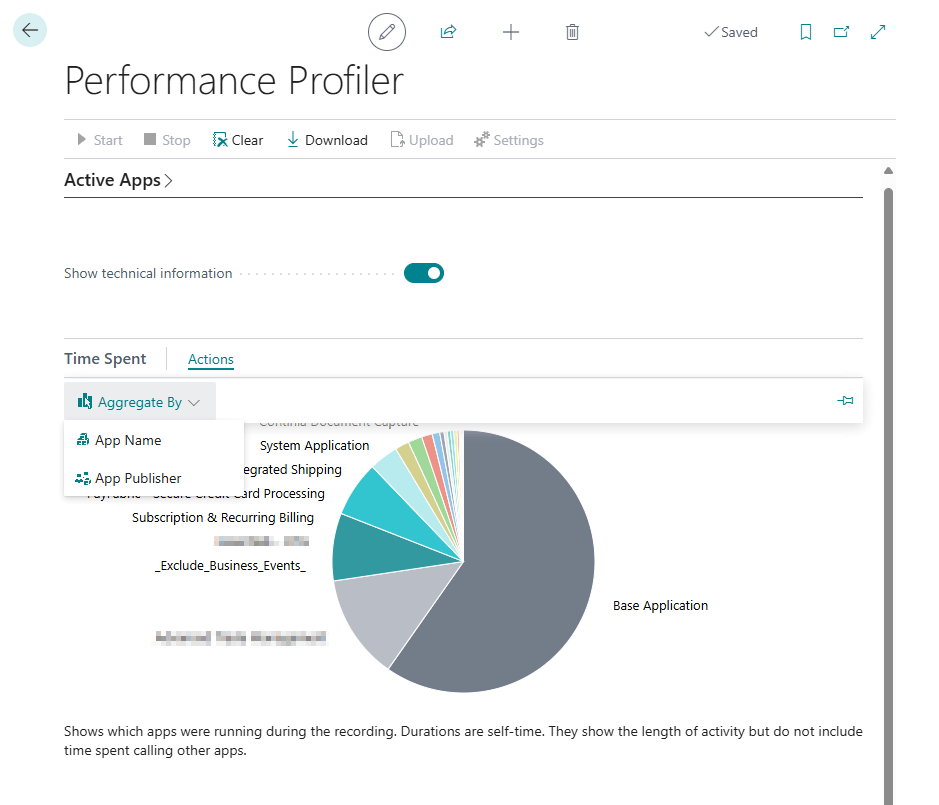
From the Profiler Schedule you can click Open Profiles. Here you will see a list of the activities. When you drill down into the profile, it will open the actual Performance Profiler snapshot. The first tab will display the Active Apps during the sampling.

Show Technical Information
If you toggle Show Technical Information you can gain insights into the code that was run during your sampling.
Within the Time Spent fast tab we have a few different insights. There is a pie chart which displays a breakdown of apps running either by App Name or App Publisher.
The Time Spent by Application Object is an overview of the objects, and how much time was spent running each object. It will tell you the Object Type, Object Name, Time Spent and the App Name.

Finally, you can view the Call Tree. This will show you the methods that were called, which object Type and Object Name they are a part of, and the duration of time that was spent on the method.
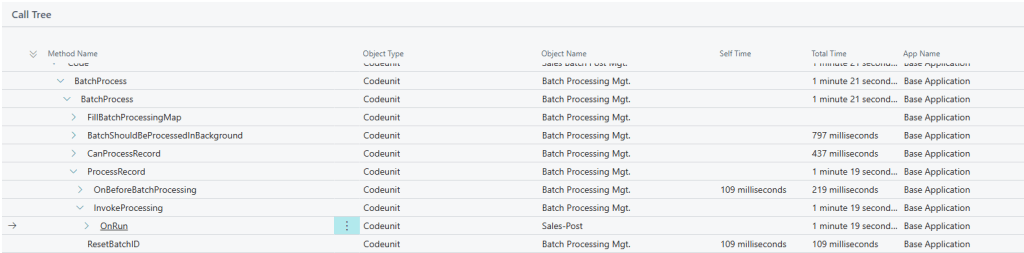
The more methods involved, and the deeper you dive into the callstack, you can see more insights. Self Time specifies the amount of time spent only in this method. Total Time specifies the amount of time spent in this method and the methods it calls.
The Performance Profiler is a great way to quickly see an overview of the code being run. Did a specific method get called? Did it get to a specific checkpoint? No? Where did an error occur? I’ve definitely been leaning more on the Performance Profiler within Business Central, and really like having the ability for my clients to schedule this for their users.
From the Performance Profiler, there is a Download button, which allows for sharing among colleagues. This will download an .alcpuprofile file, which can be uploaded back into Business Central to an existing Performance profile. You can only upload one file at a time.
You can learn more about the Scheduled Performance Profiler on Microsoft Learn
If you are interested in more of the technical details, you can learn more about the Performance Profiler here.
If you are looking for more insights, check out Marcel Charbot’s blog post “Monitor Business Central Performance with Performance Profiling” here
#msdyn365bc #BusinessCentral
