

Queries are powerful tools for data analysis within Business Central, allowing us to perform a range of calculations that help us aggregate and make sense of our data. To do this, we set a Method property on a chosen column within our query, which gives us a clear way to “manipulate” the data.
Among the built-in methods we have, there are several that work with numerical datatypes – like Decimal, Integer, Big Integer, or Duration – such as Sum, Average, Min, Max, and Count. There are even a few methods available to help us work with Dates in Business Central. This blog post will hopefully be a good demonstration of the different query methods available, and spark some ideas where you could skip expensive looping techniques in favor of leveraging queries. 😺Rogan says “don’t sleep on using Queries in your Business Central Development!”
SUM
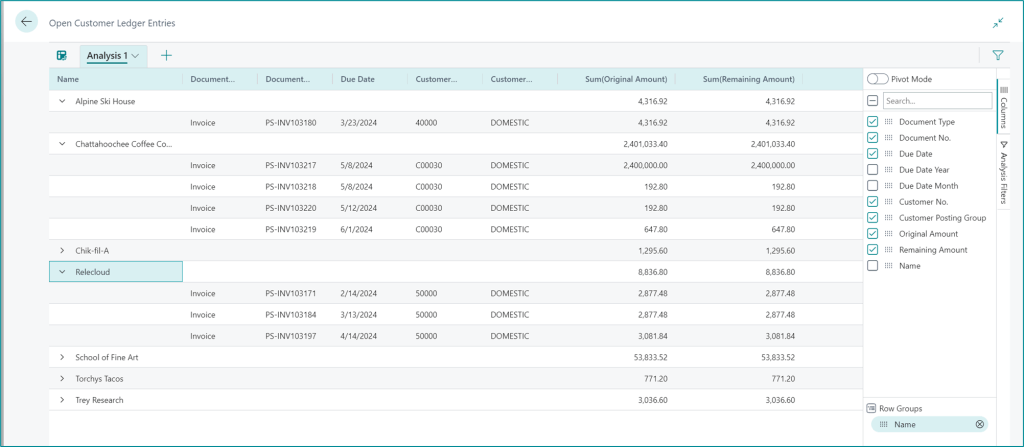
When you need to total up values—like sales amounts, quantities, or durations—the Sum method is your go-to. It’s a simple yet powerful way to get aggregate data without writing loops or manually calculating totals. This method shines in scenarios like sales reporting or inventory valuation, where the grand total is often the key metric.

AVERAGE
The Average method helps you find the mean value across records. Whether you’re analyzing average sales per customer or average shipment time, this method gives you a quick snapshot of performance trends. It’s especially useful when you want to normalize data or compare performance across different segments.

Maybe we want to offer bulk discounts once an order hits a certain dollar amount. By reviewing the average Sales Amount by Customer, we could approach specific customers first who regularly meet these sales goals, rather than meeting with a customer who typically places smaller orders.

One thing to note: When averaging field that have an integer datatype (such as Integer or BigInteger) integer division is used What this means is the result is NOT rounded, and the remainder is discarded.
For example, 5÷2=2 instead of 2.5 (or 2 1/2).
MIN
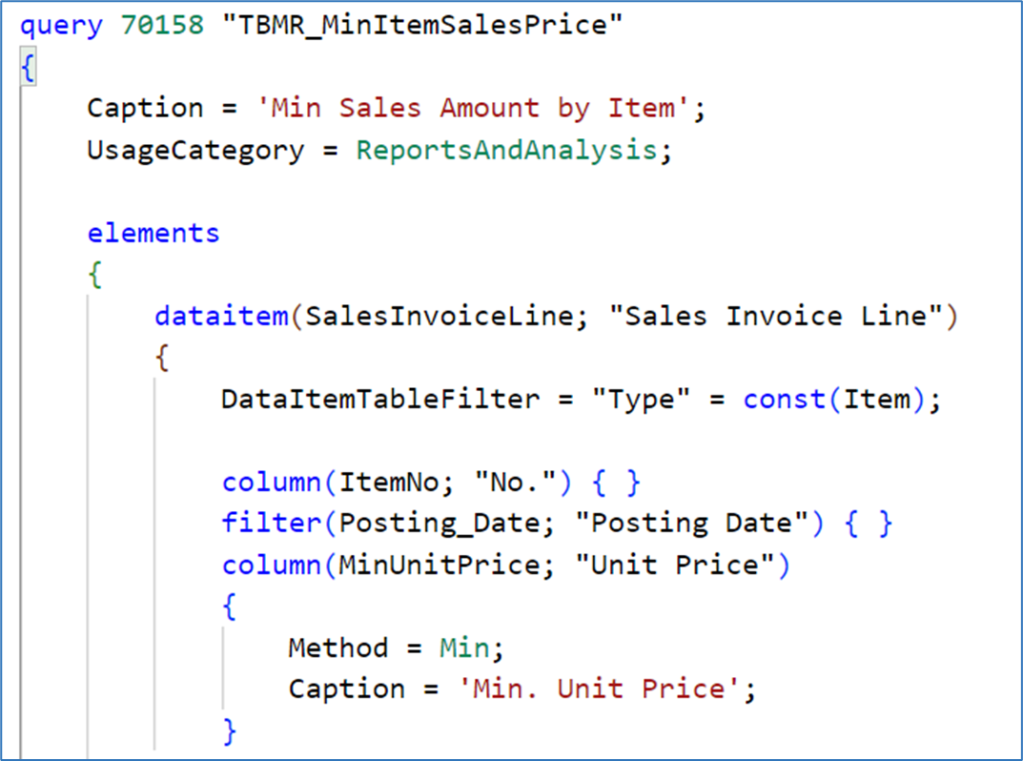
Sometimes you’re not interested in the whole dataset, rather, just the extremes. The Min and Max methods allow you to pinpoint the smallest and largest values, respectively. These are great for identifying outliers, setting thresholds, or tracking best/worst performers.
In the below example, we are looking at Sales Lines, and getting the minimum unit price for each item.
MAX
The opposite of MIN is MAX. You can use this method to retrieve the highest value in a specific column for a set of records. Sometimes you just want a quick way to see which items are being ordered the most without digging through piles of data.

By using a built-in method to find the maximum value, it gives you a fast snapshot of which items had the biggest single orders.
COUNT
This is my favorite query method. Not only can you easily get the count of records, but it’s an easy way to return Distinct records.
Let’s say you need to know the States that you are shipping to from each location. The below query would give you the distinct Location | Ship-to States, and also a count of how many orders occur for each instance.


How could we improve this query usage?
We could add the Shipment Date, and filter for orders shipping today, or this week. Maybe we need to know orders shipping for a specific carrier.
Take this one step further – you could expose a query as an API, and pull that data into Excel for a Refreshable Excel Report.
MONTH | DAY | YEAR
In addition to numerical aggregations, Business Central queries also offer methods that help us work with Date and DateTime fields. Specifically, the MONTH, DAY, and YEAR methods allow you to extract the respective integer components from a date value, making it easier to group, filter, or analyze data based on time.
These methods are useful when you are trying to break down data by calendar segments. For example. you might want to:
- Group sales by month to analyze seasonal trends.
- Count transactions by day to monitor daily activity.
- Filter records by year to compare performance across fiscal periods.
Instead of writing custom logic to parse dates or relying on complex calculations (because who remembers to handle February 29th during a leap year), you can simply add these methods directly to your query definition.
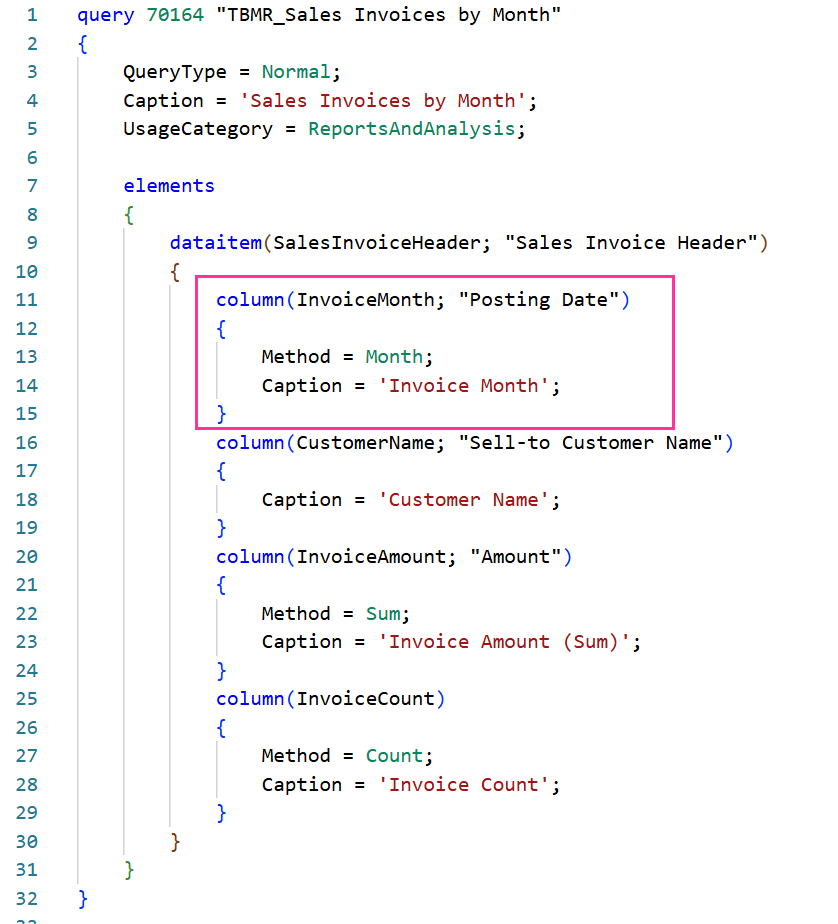
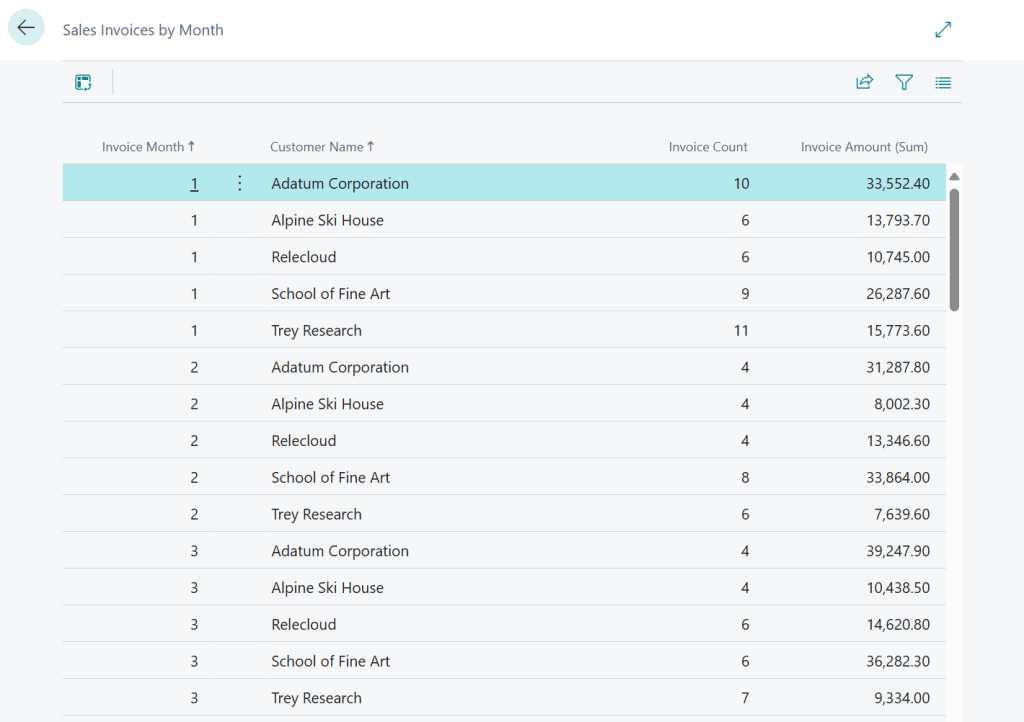
This query groups invoices by month and includes customer name, total invoice amount, and count of invoices—ideal for monthly sales dashboards.
Using query methods effectively can drastically reduce the complexity of your AL code and improve performance. Instead of looping through records and manually calculating values, you can let the query object do the heavy lifting. Hopefully these examples gave you a sense of how versatile and powerful these methods can be, and maybe even inspire you to refactor some of your existing logic. (I just did some refactoring this week!)
You can learn more about Query Methods for Business Central here
You can find my query examples on GitHub
#BusinessCentral
