As a developer, we oftentimes participate in code reviews where we are either sharing our screen, or viewing someone else’s code. How hard is it to identify where some code needs to be changed, or it’s hard to follow someone navigating through their code.
Perhaps you are rubber duck debugging, and your code still isn’t making sense. That whole “it works in my Docker container, but not in the Sandbox”, and wouldn’t it be nice to debug WITH a co-worker? You can both set break points within the same code base, and debug within someone’s local Docker container.
Maybe you want to speed up development. One person is adding fields and pages, and someone else is adding some custom business logic, but it relies on those fields being created. We know that you need to add the related fields to the “sister tables” to the data flows through to all the related posted tables, but man, does that take some extra effort. You can share one person’s VS Code instance, and pair program!
If any of the above scenarios sound interesting to you, then you need to install the Live Share VS Code extension!
Installation & Setup
The first thing you will need to do is download and install the LiveShare Extension for VSCode. Here is a direct link. You will need to sign in to Visual Studio Live Share so everyone knows who you are. You can sign in with either a Microsoft account or a GitHub account. Just select Live Share on the status bar, or through the Command Palette (Ctrl + Shift + P) select Live Share: Sign In.
Join a session within VS Code
If someone else is going to share their session with you, they will share a link with you, most likely through Microsoft Teams. If you click the link, it will open VS Code in your browser.
I would suggest copying the link, and within VS Code, using the Command Palette click Live Share: Join Collaboration Session. You will paste the link, and hit ‘Enter’ to confirm.

Alternatively, from your Activity Bar along the left side of VS Code, click the Live Share logo. You can then click Join, and paste the URL that was shared with you.
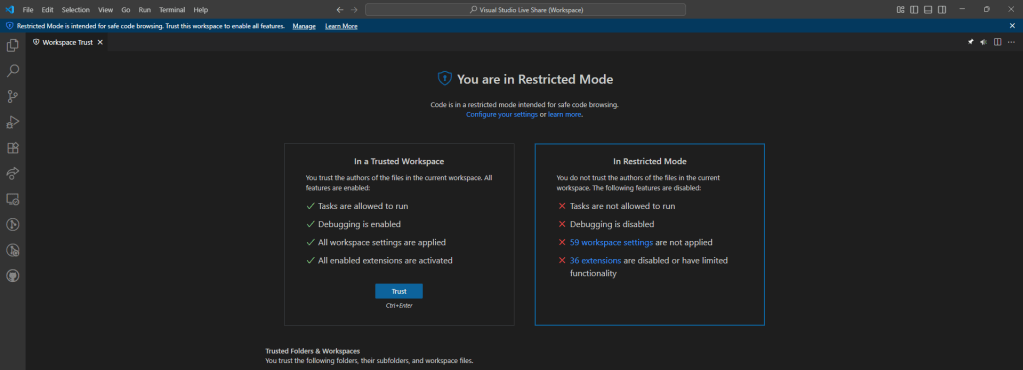
When you join a Live Session from within your VS Code, and you may see a blue bar across the top.
“Restricted Mode is intended for safe code browsing. Trust this workspace to enable all features.” Click Manage, Then Trust (or Ctrl + Enter). This allows all of the workspace settings to be applied, and all enabled extensions are activated. Hello color coding, GitHub Copilot, LinterCop, AL Actions and more!
Start a Live Session
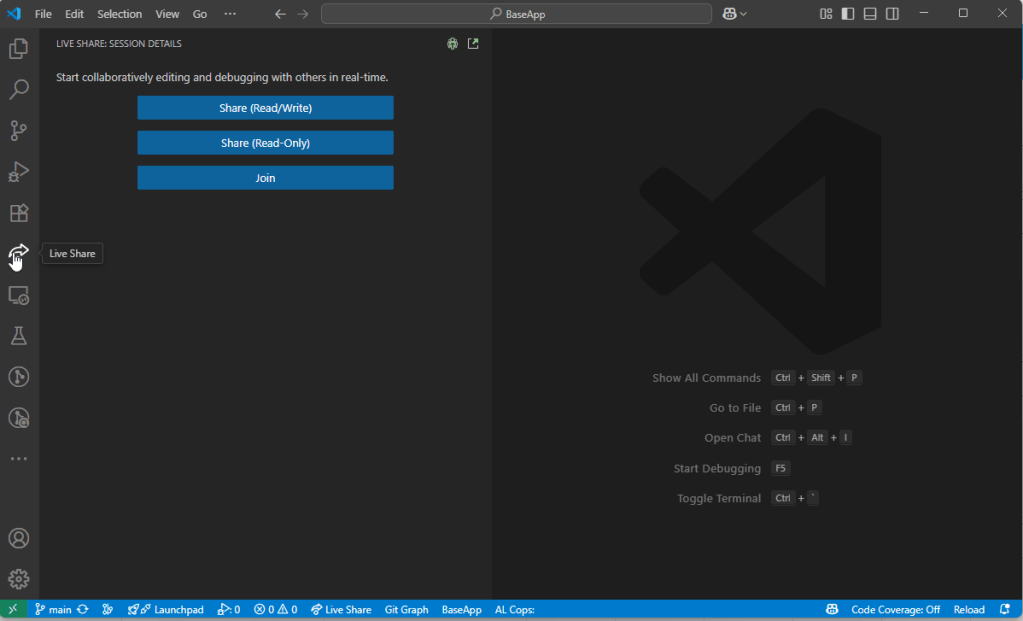
If you would like to share your code, from your Activity Bar along the left side of VS Code, click the Live Share logo. You can then Share (Read/Write) or Share (Read-Only). Clicking either of these options will start a Live Share session, and copies the URL to your clipboard. You can then easily share this link with up to 30 individuals you would like to collaborate with.
Once people have started to join the Live Share session, you can see all of the Session Details from the Live Share Activity Pane.
Participants
This lists out who is all a part of the Live Share session.
There are details about what type of access each participant has (Read or Read-Write), as well as if they signed in with an account, or may have just joined anonymously, say through a web browser.
You can also see where a participant is in the code base.
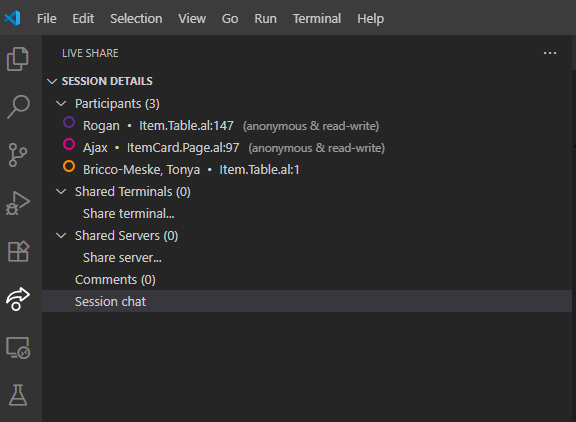
In the screenshot above, you can see Rogan is viewing the Item Table and on line 147, Ajax is viewing the Item Card, and Tonya has just opened the Item Table. Let’s say I want to see what Rogan is working on. I can right click on him, and I am presented with a few different options.
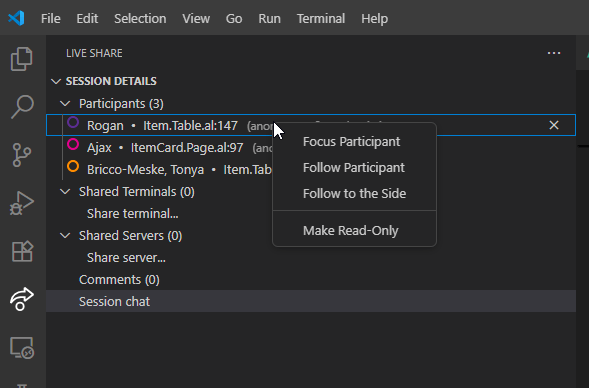
You can Follow Participant, or even Follow to the side. What this does is opens Rogan’s view of the code in another tab to the right. I can keep working on my code, but can also see what he is doing within the same window of VS Code.

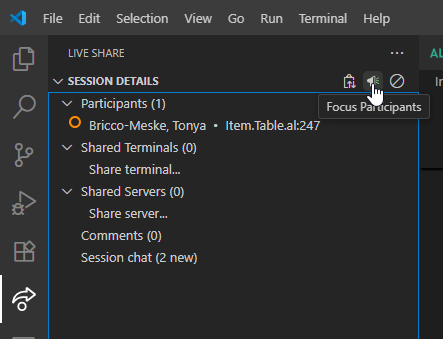
Let’s say you were in a call with the participants, and you wanted to draw everyone’s attention to what you were working on. You could right-click “Focus Participants” and everyone would start following you. If you only want one person’s attention, you can just right-click on their name and “Focus Participant”.
Collaboration, Pair Programming & Debugging
Now we have the ability to work collaboratively as a team. We are all working on the code base of the person who started the Live Share session, I’ll refer to the person who started the session as the “lead”. One person can add fields, while another person works on a report, or maybe adds the field to pages. When your pair programmers make a change, the commit message for the lead auto-populates with a message indicating who co-authored the commit.
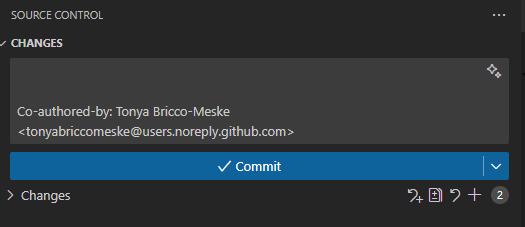
The code will still be checked in and commited by the lead.
The lead is the only one who can start a debugging session, but the pair programmers can assist in the debugging process. What this means is pair programmers can set breakpoints, view the callstack, create their own watches, and actually help navigate through the debugging process (think step in/over, continue).
This has changed the way I work with my coworkers. I can easily see what they are working on, and navigate through their code at my own pace. It’s really helped our code reviews feel more collaborative. Our internship program is also using this to facilitate job shadowing, so they can really experience what it takes to be an AL developer. I also don’t have to say “Hey, move this here, or add this there.” Instead I am able to effectively pair program with my teammates.
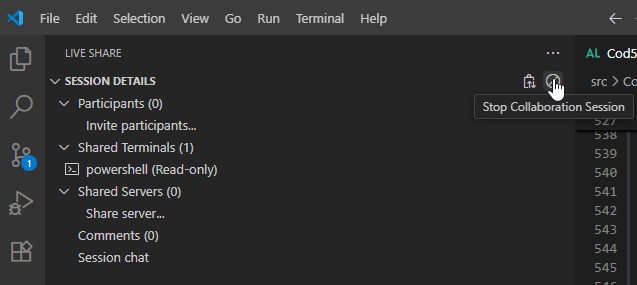
Don’t forget to end your session by clicking “Stop Collaboration Session”. Otherwise your coworkers could come back and leave you some fun comments in your code 🙃